|
Stocks are fundamental to generating behavior in a system. Stocks are also known as levels, accumulations, or state variables. Stocks change their value continuously over time.
Flows, also known as rates, cause stocks to change.
Stock and Flow Diagrams
Stock and flow diagrams are ways of representing the structure and dynamics of a system.
The stock and flow diagramming conventions (originated by Forrester 1961) were based on a hydraulic metaphor - the flow of water into and out of reservoirs.
Hydraulic Metaphor:
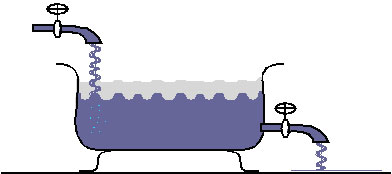
The quantity of water in the bathtub at any time is the accumulation of the water flowing in through the tap less the water flowing out through the sink (assume no splashing or evaporation). In exactly the same way, the quantity of material in any stock is the accumulation of the flows of material in less the flows of the material out.
An equivalent representation of stock and flow structure is shown on the diagram below:
Stock and Flow Diagram:
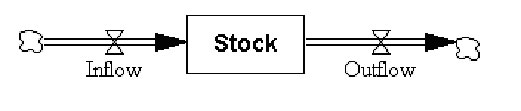
Sources and sinks for the flows in a system have infinite capacity.
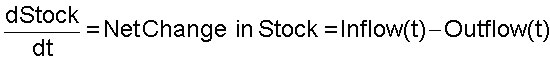
The stock and flow diagram has a precise mathematical meaning. Stocks accumulate (integrate) their inflows less their outflows. The rate of change of a stock is the total inflow less the total outflow. Thus a stock and flow map corresponds to a system of integral or differential equations. However, stock and flows are much easier to work with and explain.
Integral Equation:
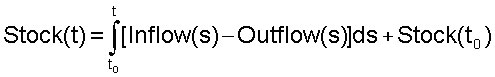
or in Vensim notation

Differential Equation:
Mathematical description of a system requires only the stocks and their rates of change. However, it is often helpful to define intermediate or auxiliary variables. Auxiliaries consist of functions of stocks and constants.
There are several ways to identify the stocks in the systems. In the snapshot test you imagine freezing the system at a moment of time - the measurable quantities are the stocks, while flows are not instantaneously observable or measurable. Units of measure can also help identify stocks and flows. If a stock is measured in units, its flows must be measured in units per time period.
|