|
The behavior of a system arises from its structure. The most complex behaviors usually arise from the interactions (feedbacks) among the components of the system, not from the complexity of the components themselves.
All dynamics arise from the interaction of just two types of feedback loops, positive and negative.
Positive loops tend to reinforce or amplify whatever is happening in the system. Negative loops counteract and oppose change.
Casual loop diagrams are an important tool for representing the feedback structure of system.
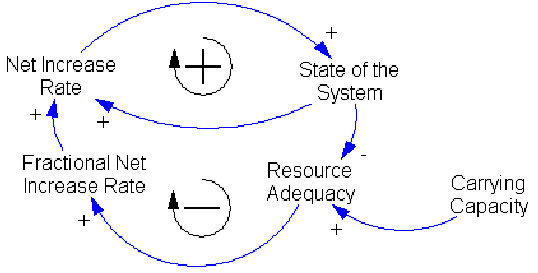
In the figure above, State of the System determines Net Increase Rate and Net Increase Rate adds to State of the System. The arrows indicate the casual relationships. The + sign at the arrowheads indicate that the effect is positively related to the cause: an increase in the independent variable causes the dependent variable to rise above what it would have been (a decrease causes a decrease). The loop is positive (or self-reinforcing), hence the loop polarity identifier + (or R).
Negative loops are self-correcting. Negative signs mean an increase (decrease) in independent variable causes the dependent variable to decrease (increase) beyond what it would have been. As State of the System approaches its Carrying Capacity, resources per capita diminish thereby reducing the Fractional Net Increase. The - (or B) in the center of the loop denotes a negative (or balancing) feedback.
Casual loop diagrams are very useful in many situations. They are used effectively at the start of the modeling project to capture mental models and represent interdependencies and feedback processes.
One of the most important limitations of casual diagrams is their inability to capture the stock and flow structure of system.
|